The complexity of the proprietary data set – big data from multiple sources – and the bespoke metric derivations and terminology applicable to our operations, meant it was necessary for there to be a high degree of communication and collaboration throughout the project. Colin was organised, proactive and flexible, and the outcome of this approach means we have not only delivery of the dashboards, but have undergone with Datawoj a rich process of learning through joint problem-solving – and we are delighted with the result.
Situation:
yesHEis is an app operated by global charity Christian Vision (CV) to help Christians share their faith online. With 3 million users worldwide, its operation by CV teams and partners is supported by a substantial technology infrastructure and sophisticated use of social media and Customer Relationship Management platforms.
Task:
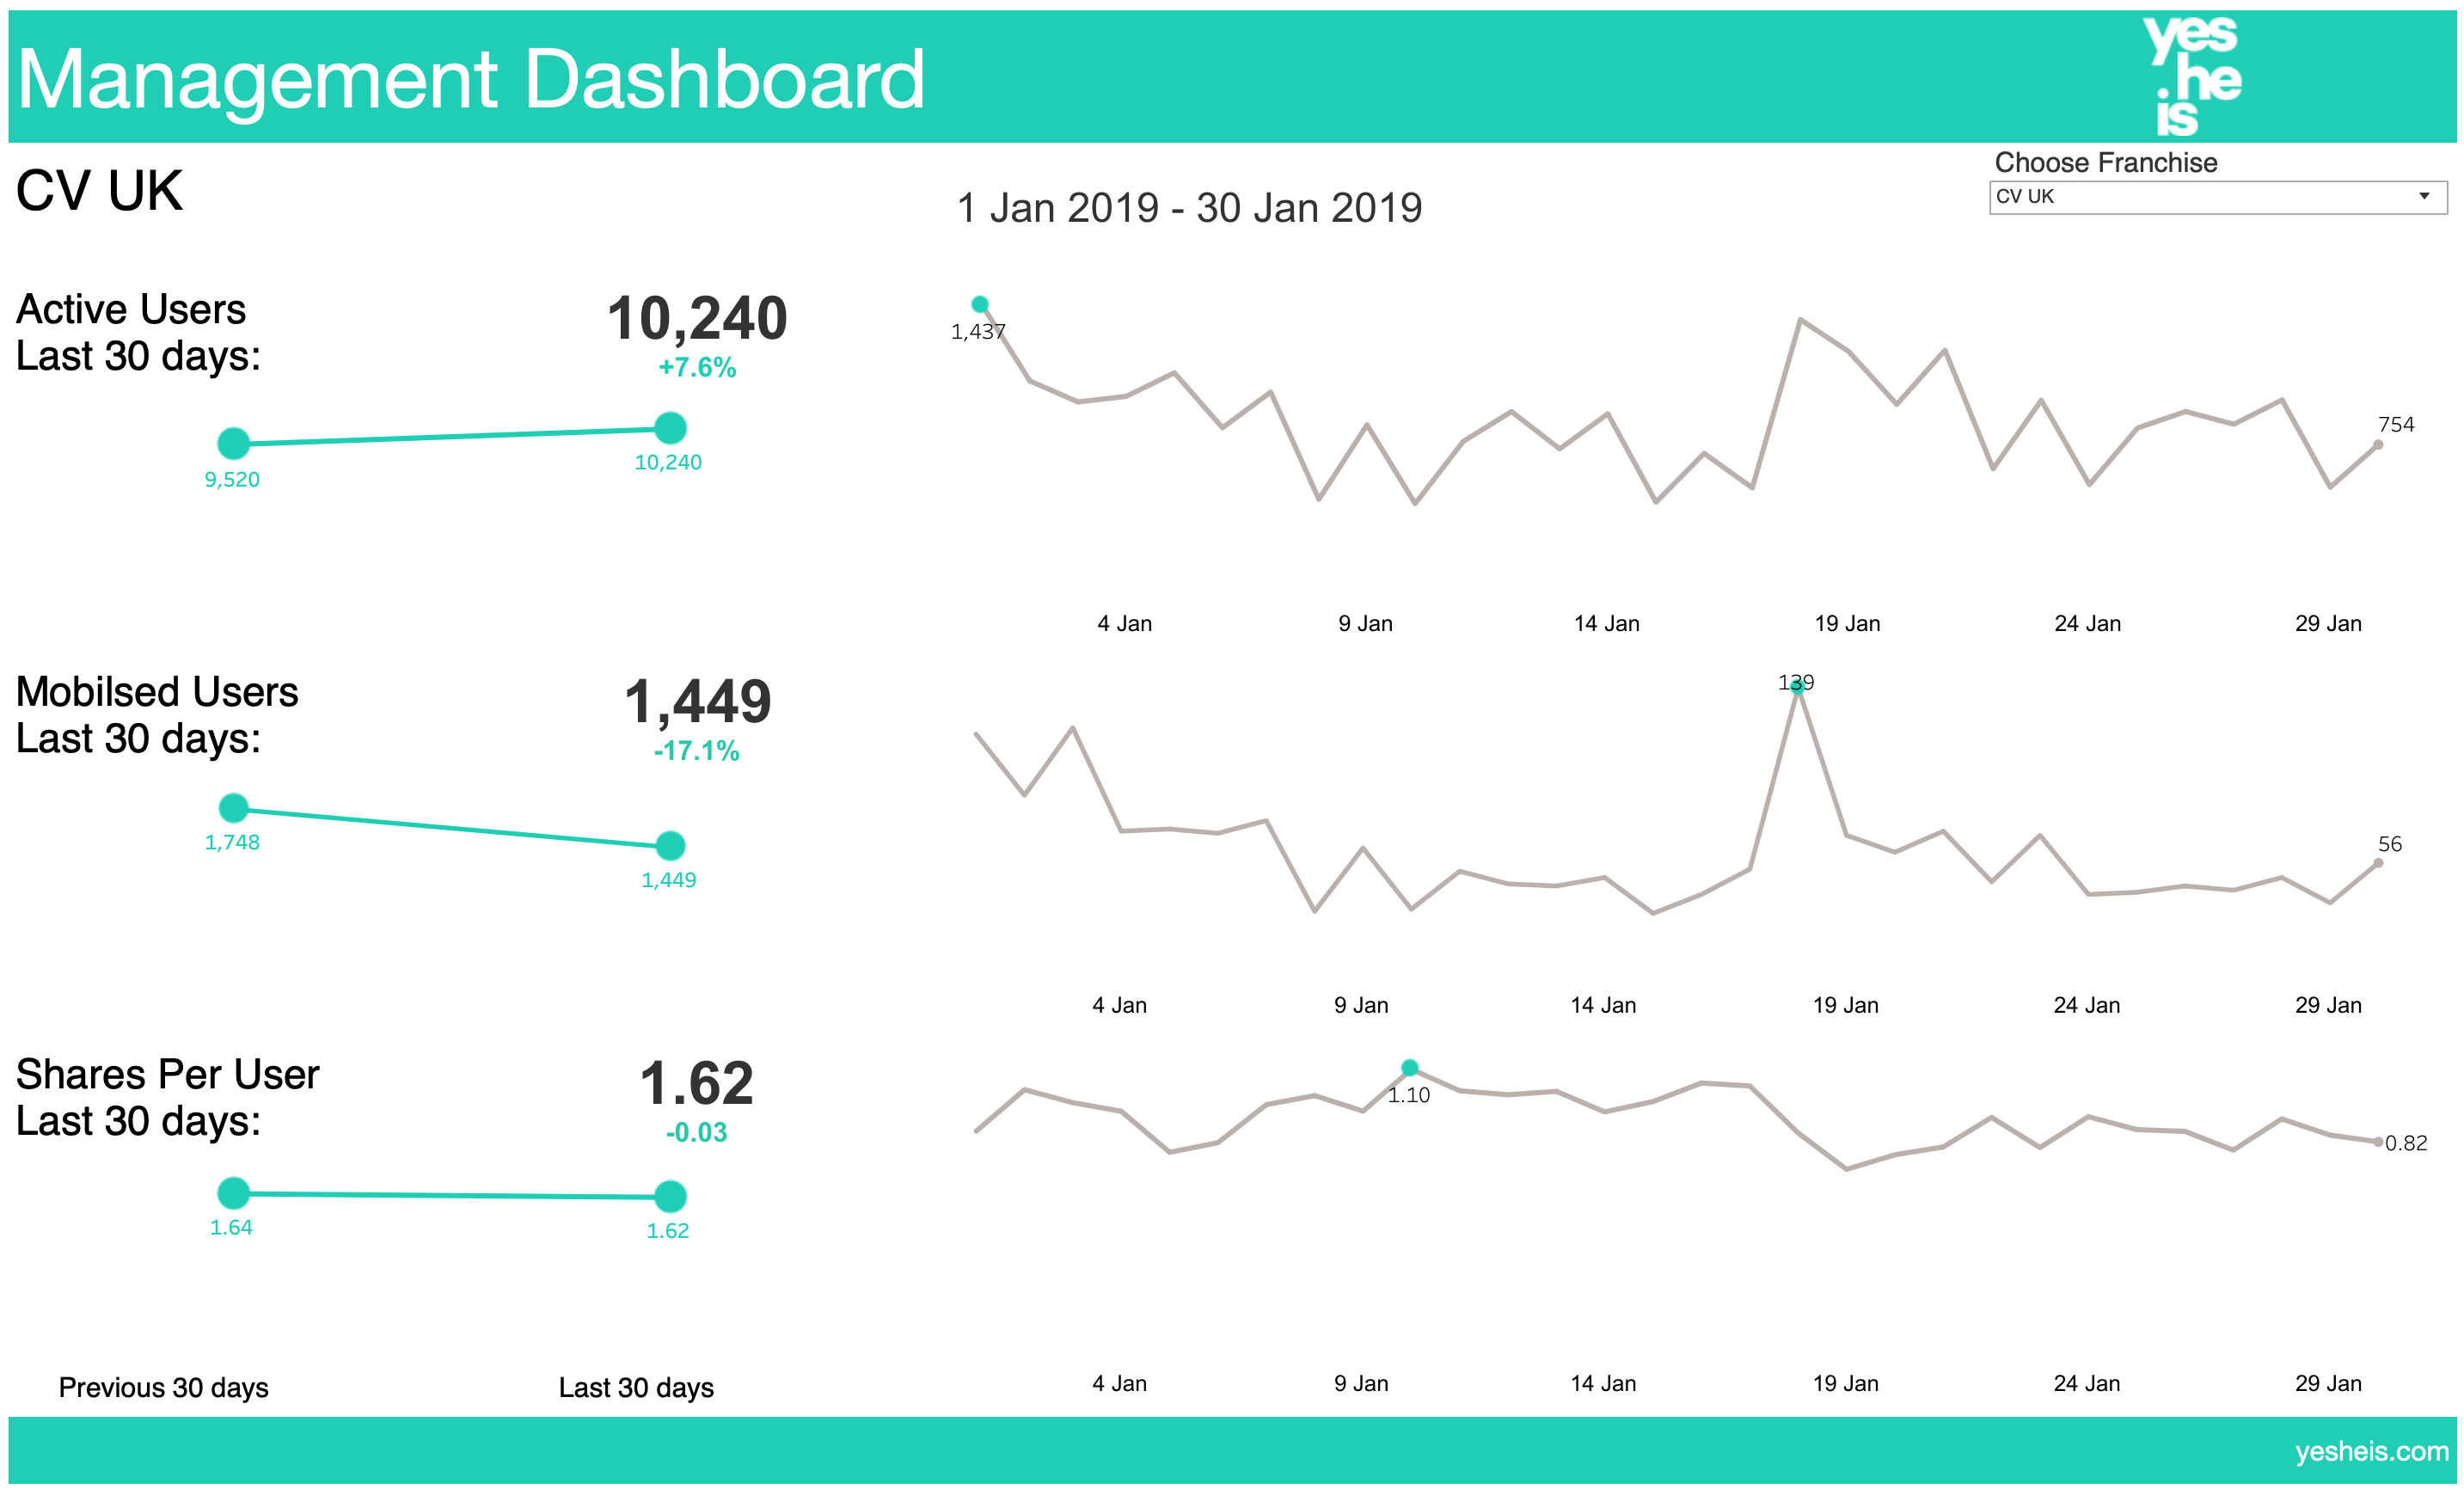
Design and build of 4 dashboards required to display key performance indicators (KPI) of the yesHeis app. They needed to be interactive to allow filtering by each one of 16 international franchise teams as well as enabling a view across all teams. The dashboards would cover KPIs relating to management, marketing, content and community metrics.
The data source was a CV data warehouse consisting of several different schema and tables. Some of the required metrics required complex derivation in Tableau Desktop.
Actions:
Datawoj worked closely with CV to implement a solution which included:
- Collaboratively researching ways to join mismatched entities from multiple sources
- Blending of multiple data sources
- Cross database filtering
- Design of dashboards including testing and iteration
- Derivation of complex metrics using Table Calculations and Level of Detail expressions in Tableau Desktop
- Data visualisation techniques including sparklines and slope charts for example.
Results:
The dashboards were designed, built and quality assured to the required specifications. They are currently being used in the field by the franchise teams to effectively manage their daily performance of the YesHeis app. This has saved the client considerable time in terms of building out the dashboards as they had limited capacity.
Learning outcomes:
The data itself is challenging enough to work with internally, but to expose it to an external collaborator raised this to a new level! It re-emphasises the essential role of data preparation and cleansing in any data operation, and even more so if complex big data is to be rendered usable by analysts. It was anticipated at the start it would be necessary for Datawoj to undergo a process of orientation into CV’s data: yet beyond this we had to spend substantial time making the data fit for purpose.

Recent Comments