One of the most common functions I get asked for by clients in dashboard designs is whether they can drill down from one level of detail into a finer level of granularity. By using interactive features such as dashboard actions we can reveal hidden insights all within the same dashboard!
In this interactive visualisation, we can see that sales in 2018 were higher than in 2017 for each of the three main categories in Tableau Superstore.
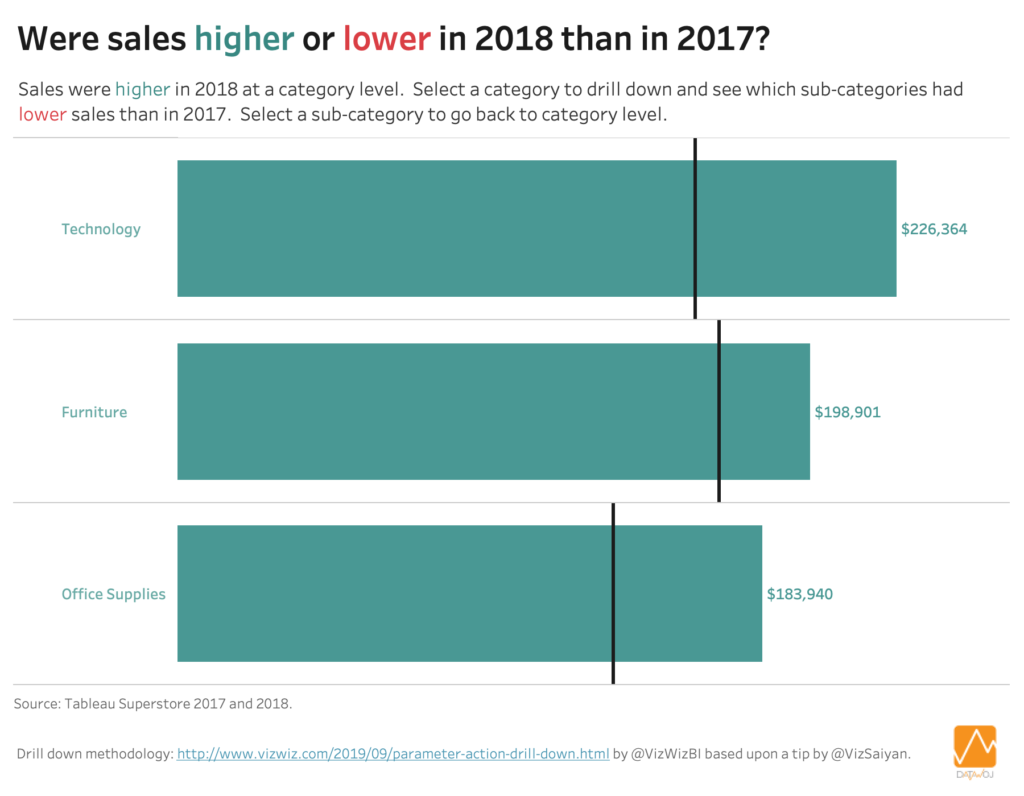
However, when we drill down into the more detailed sub-category level we see that there are some products where sales were under performing compared to the previous year. Colour can be used to highlight this pattern at a glance. Hover over tooltips reinforce this narrative of whether performance is on target or below target.
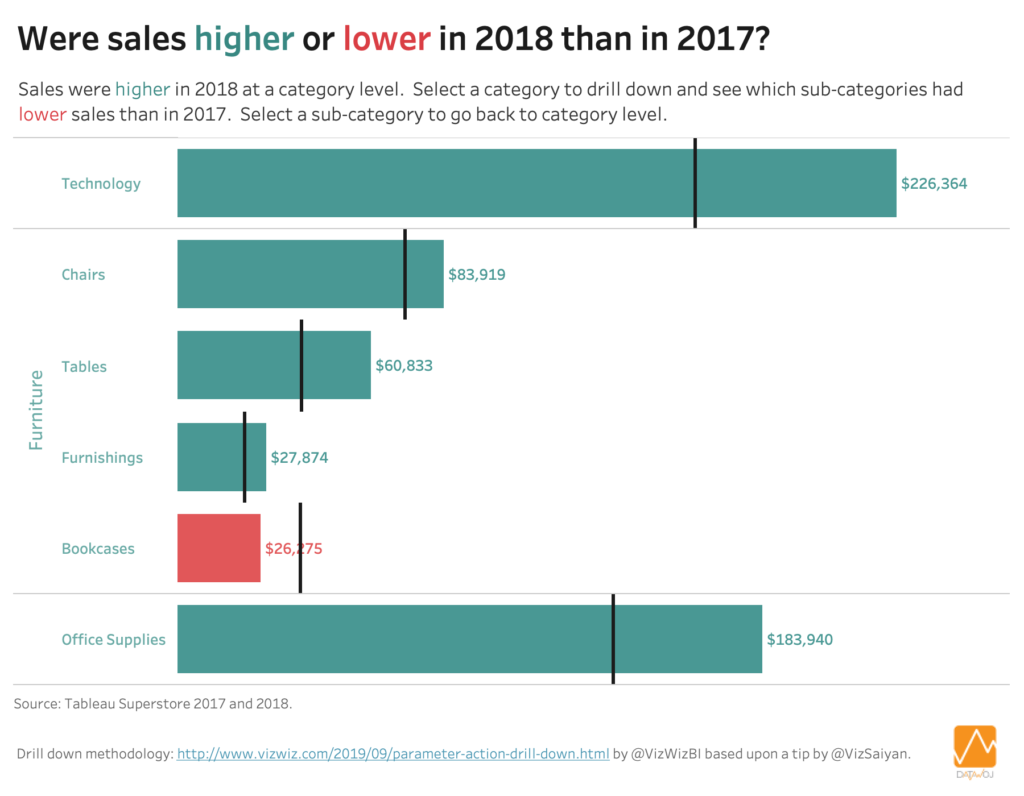
The advantage of being able to drill down in this way is that it provides additional insight without using valuable dashboard real estate. Additionally it provides users with an engaging way to interact with the visualisation.
To learn how to construct this visualisation using Parameter Actions in Tableau visit this #TableauTipTuesday by Tableau Zen Master Andy Kriebel.
Recent Comments