Data visualisation versus visual analytics
I recently read a Tableau white paper on visual analytics, which stated that data visualisation answers the ‘what’ questions, whereas visual analytics answers the ‘why’ questions. This inspired me to create my own visual analytics visualisation based upon Tableau Superstore data and the Whitepaper example. This was also a great chance to try out a new feature called dashboard navigation buttons.
For example in my visualisation, sales by category shows furniture sales are generating low running profits. But why is is this? Filtering by region shows this is a problem across the product range.
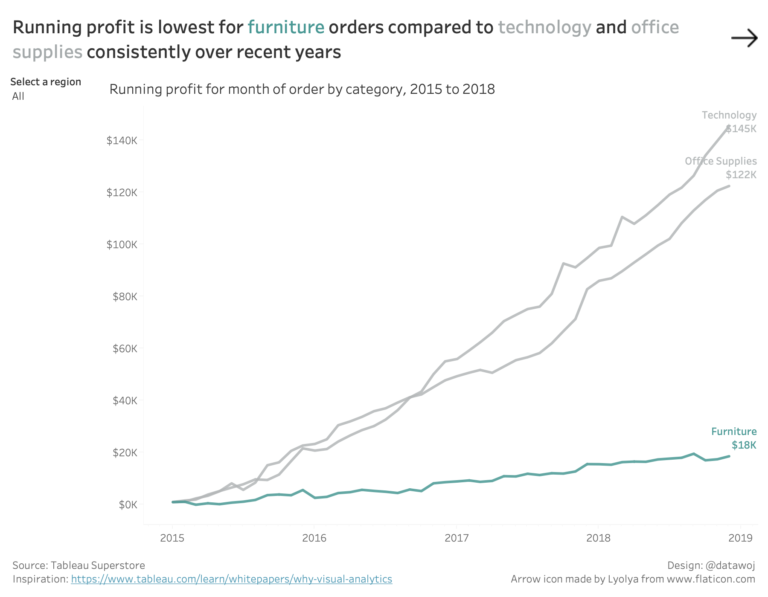
Start by looking at trends by broad category.
Looking at sub-category shows us that tables are generating a low profit despite high sales.
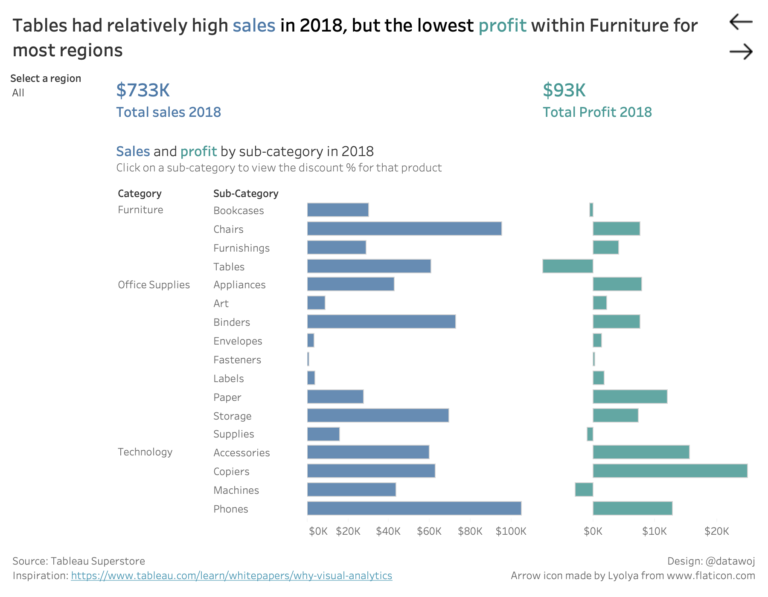
Drilling down by sub-category shows that there may be an issue with low profits for table sales.
Interactive features such as filter actions on dashboards allow our audience to drill down further into their data to more detail. By changing the view to show sales by profit, coloured by % discount for each order we can see that high levels of discount are the cause of the low profits.
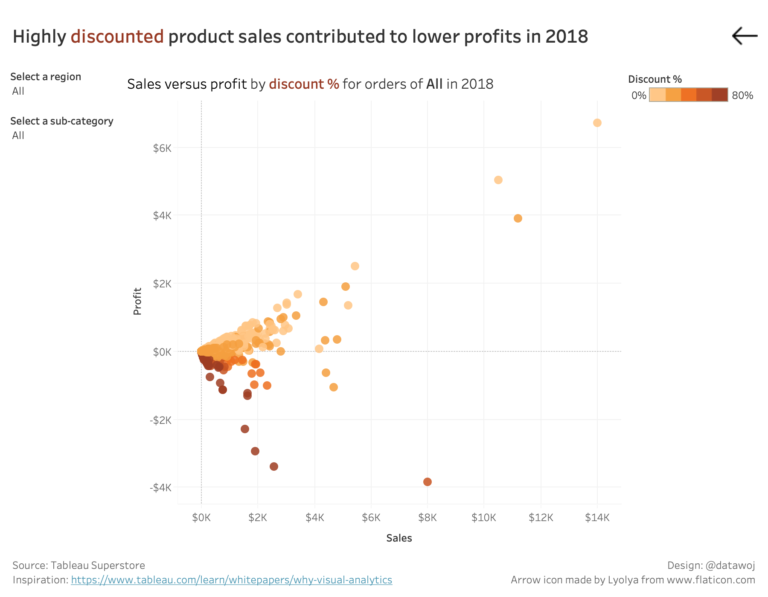
Changing the view presents new insights.
Exploring new questions and answering them visually
Building different views allows our audience to see different insights from the same data. This means being able to quickly ask and answer business questions. This is important to be able to see the underlying cause of problems. It also means that we can go exploring in detail different paths of analysis, which is a great way to engage our audience’s curiosity.
Navigation design dilemmas
In terms of my approach to design. Initially I was keen to show 3 different stages of analysis as separate dashboards rather than try to answer several business questions with one all singing and dancing dashboard. This presented several dilemmas in terms of dashboard navigation. I could create a storyboard of dashboards for example. Alternatively navigation between sheets through dashboard actions. I decided to try out Tableau’s new dedicated dashboard navigation buttons.
I think navigation between dashboards is a useful functionality in terms of limiting the amount of information we ask our audience to process in any one visualisation. It also enables us to guide our users through a process of visual analysis and storytelling. However, it does create another stage for our users to go through compared to more composite views which include several visualisations in one dashboard. For example, I created this view combining the sales, profit and discount view into one dashboard to allow for drill down filtering in one place. This removes the need to navigate from one dashboard to another.
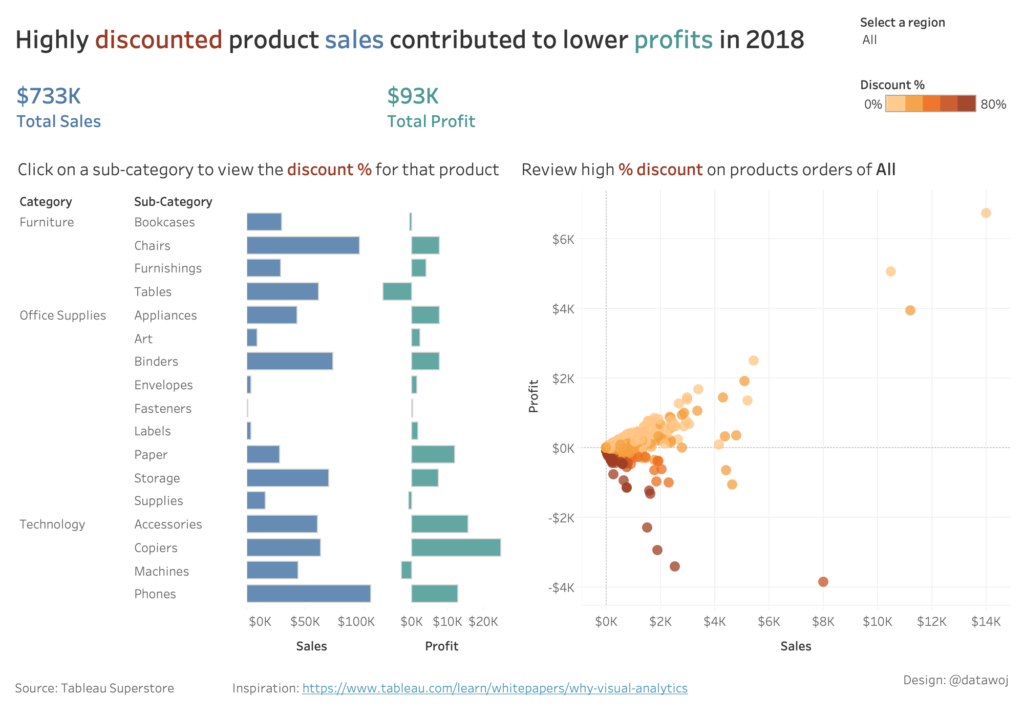
Composite view of sales and profit allows quick drill down into product discounts.
The key is to step back and ensure a balance between the right amount of information to present the insights necessary and retaining a nice clean visualisation, which is not overly cluttered. As soon as the dashboard starts to look too complicated, then consider moving some elements over to another dashboard incorporating some navigation functionality.
Recent Comments