One of the challenges of analysing data is dealing with imperfect datasets. For this week’s #MakeoverMonday Challenge, I visualised the sleep patterns of Americans by age and gender over time. The data is interesting as it shows most Americans aged 15 and over are sleeping more than in 2003. However, the data includes a wide definition of sleeping, so needs to be taken with a pinch of salt!
The original viz
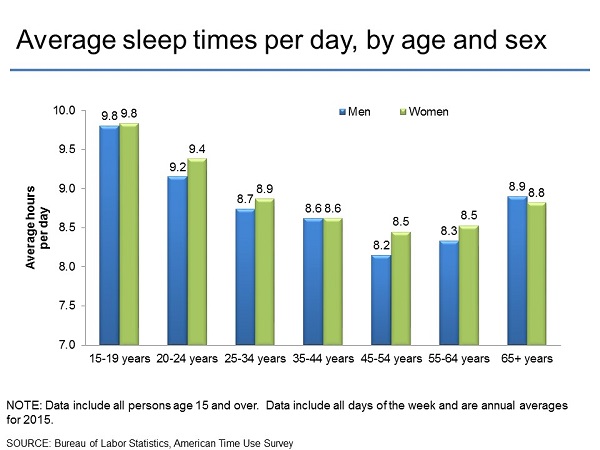
What did I like?
- Clear title telling me what the chart is about
- Well labelled bars
- Not traditional blue and pink for gender
- Clear notes about the data under the chart
What could be improved?
Although it looks like a well constructed chart, there are a few minor issues which we can clean up to make it more effective. For example we could:
- Golden rule is that bars should start at zero as otherwise the comparison is distorted
- Remove the y-axis as the bars are labelled already
- Tidy up the x-axis by removing the repetition of ‘years’ for a cleaner look
- The 3D shading on the top of the bars makes it difficult to judge where they actually end
- The chart doesn’t really tell a story as it is quite descriptive
- There is a rich data source to show trends over time, which could be explored
My makeover:
I wanted to try a different visual approach to show the trends by age and gender over time. I decided to use a distributed slope chart, with a take-away title and a subtle use of colour. I could have stacked the age groups into a single slope chart, but I felt this would look cluttered as there would probably be quite a lot of overlapping labels. The focus of my story is comparing older men and women in the title as well as by using deeper shades of colour compared to the other age groups.
I also felt it was important to qualify the study’s definition of sleeping. This is critical as analysis of data out of context can lead to inaccurate insights and poorer decision making as a result.

Distributed slope charts shows change over time by age without cluttering the view.
Recent Comments