This is a data visualisation comparing restricted diets across the Globe.
The aim of this data visualisation is to improve upon an original as featured on http://www.makeovermonday.co.uk/data/ for week 39.
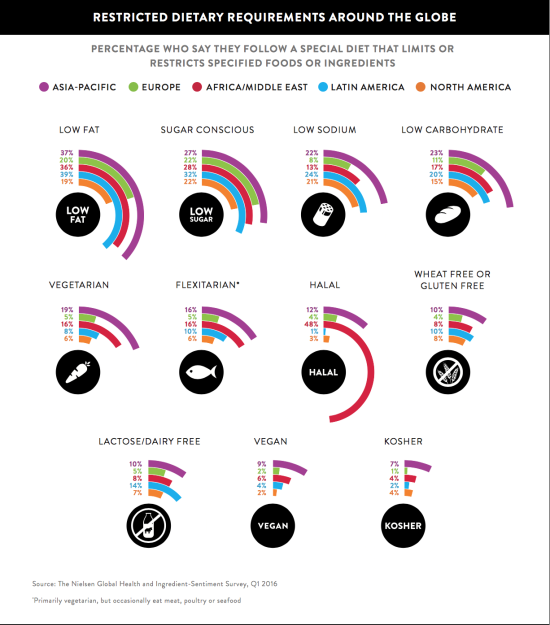
What I liked:
- The engaging colours
- Icons are recognisable
- Clear title / sub-title
- Comparison of continents
What I disliked:
- The icons are distracting
- Too many colours at once
- Bendy bars are not accurate compared to straight bars
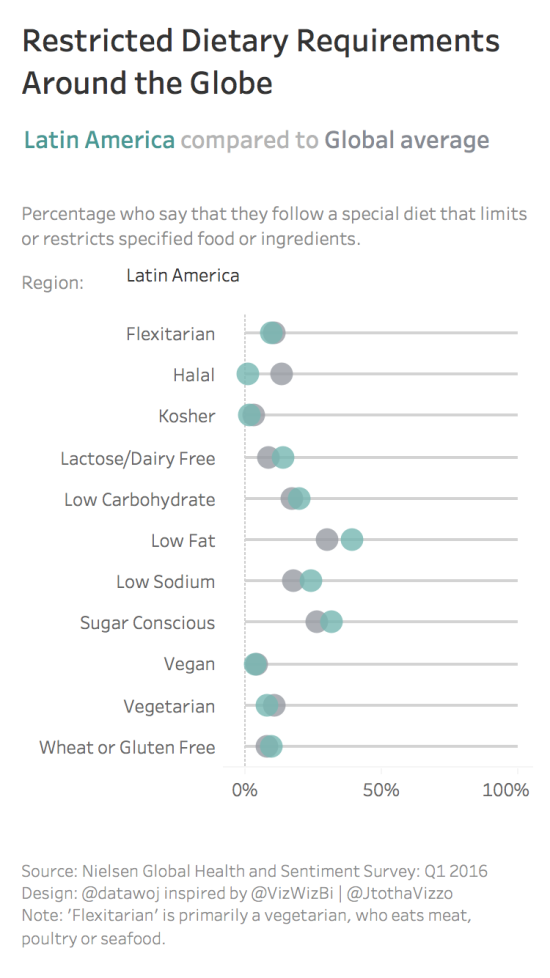
- I would prefer to compare Global Regions rather than diets
My goals:
- To keep it clear and simple
- The chart is a connected dot plot, designed for a mobile phone
- I wanted to utilize interactivity to allow the user to compare each Global region to the Global average via a drop down filter. The dashboard title, chart colour and tooltips automatically update depending upon which region is selected
Benefits and challenges:
The benefits of this approach are that it supports a quick at a glance view of the most popular dietary choices.
The challenge is to incorporate all the detail of a data visualisation on a reduced scale.
The interactive version is available on Tableau Public.
Recent Comments