In this article we will explore how colour, position and text can be used to adapt the frame and focus of data stories for different audiences. The aim is to highlight the insights most relevant to an audience so they are more likely to engage and understand the information presented. The analysis will be based upon test data from a hypothetical public sector satisfaction survey as an example.
The frame and focus of data visualisations are editorial decisions made at the design stage of any data visualisation as discussed by Andy Kirk in his 2016 book Visualising Data. The frame of view defines which criteria are filtered in and out of the visualisation. Focus is about which features require highlighting or pushing to the background so the audience pays particular attention to some insights more than others.
Scenario
Imagine a research analyst has been asked to visualise the results of a resident survey relating to satisfaction with public services provided by ‘Anywhere’ Council.
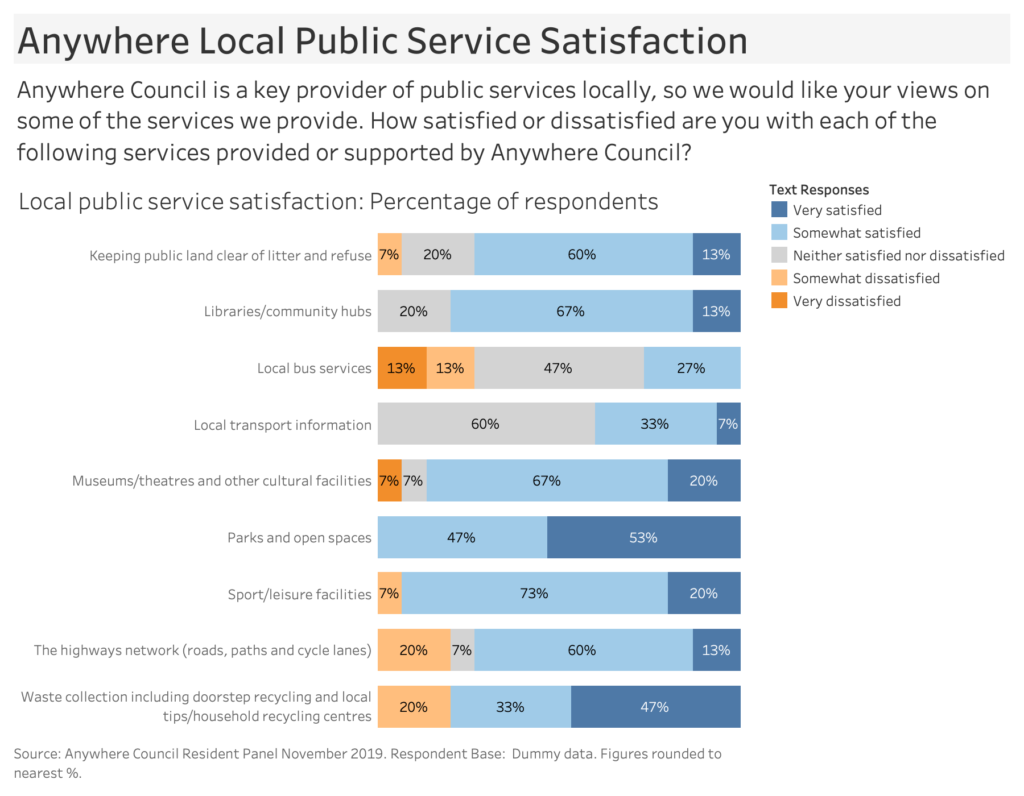
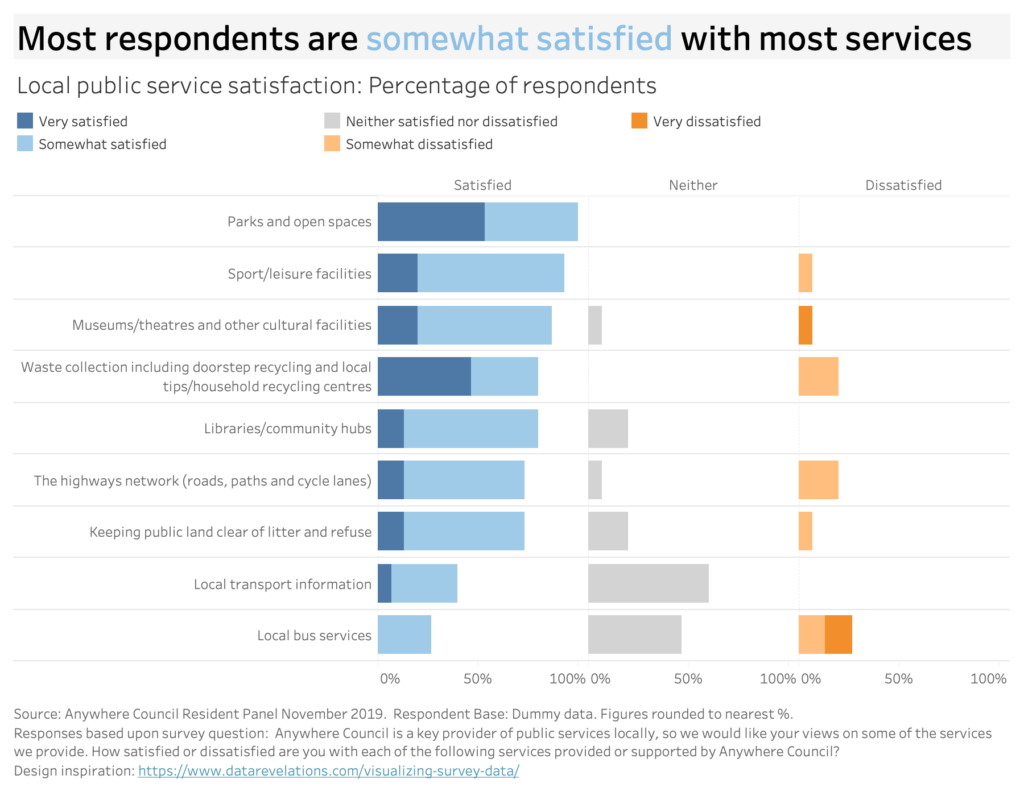
Standard Likert Chart
The starting point is a stacked bar chart which is often used to visualise ‘Likert’ scale based questions, which use words to rate satisfaction levels. The frame of view is detailed including very dissatisfied through to very satisfied. This means there is quite a lot of colour, which makes it confusing at a glance to see what the data story actually is. Those ‘very satisfied/dissatisfied’ segments which share a baseline to the left and right are easier to compare than those segments in the middle which do not. There is no focus in terms of sentiment about a particular service. This makes the visualisation descriptive in nature, leaving the insights up to the audience to decide upon.
Simplify the frame of view
One technique we can employ is to create some ‘super categories’ to simplify the amount of segments in the visual. For example, the percentage of very satisfied and satisfied respondents are combined to show total satisfaction. This simplifies the frame of view so it is easier to comprehend.
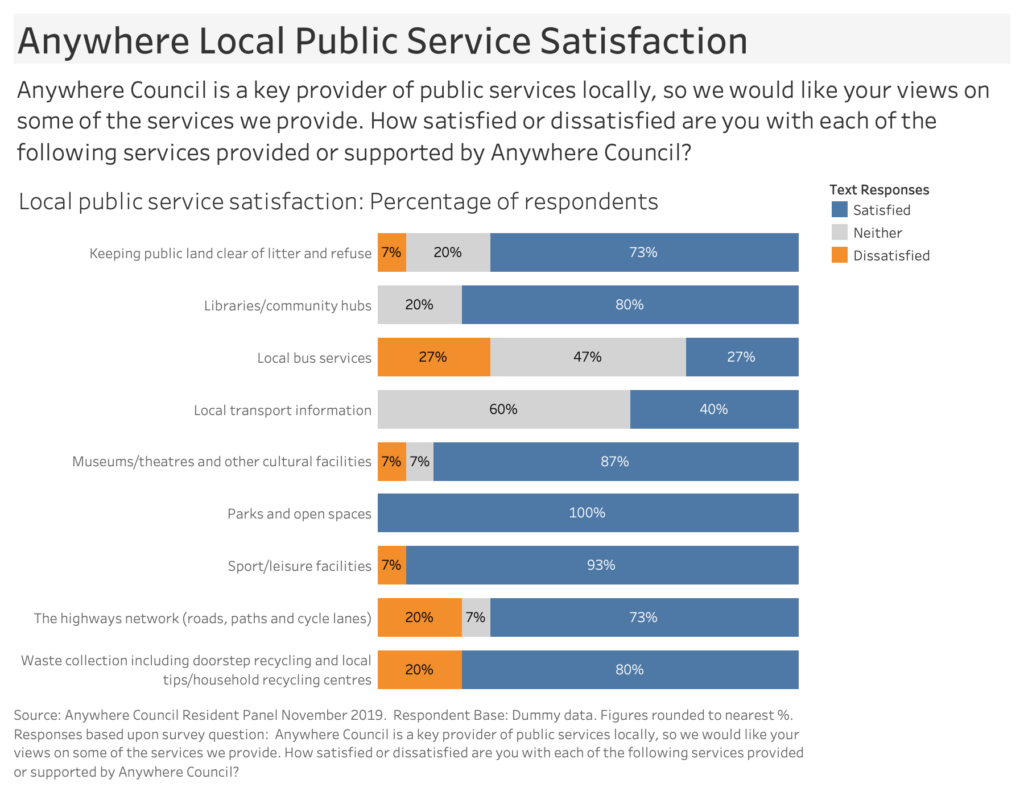
Focus on the positive
In this example satisfied respondents are coloured in contrast to the other responses, which are shown in grey. This creates a focus upon positive opinion. However, there is still a ‘so what?’ factor in terms of perceptions of individual services.
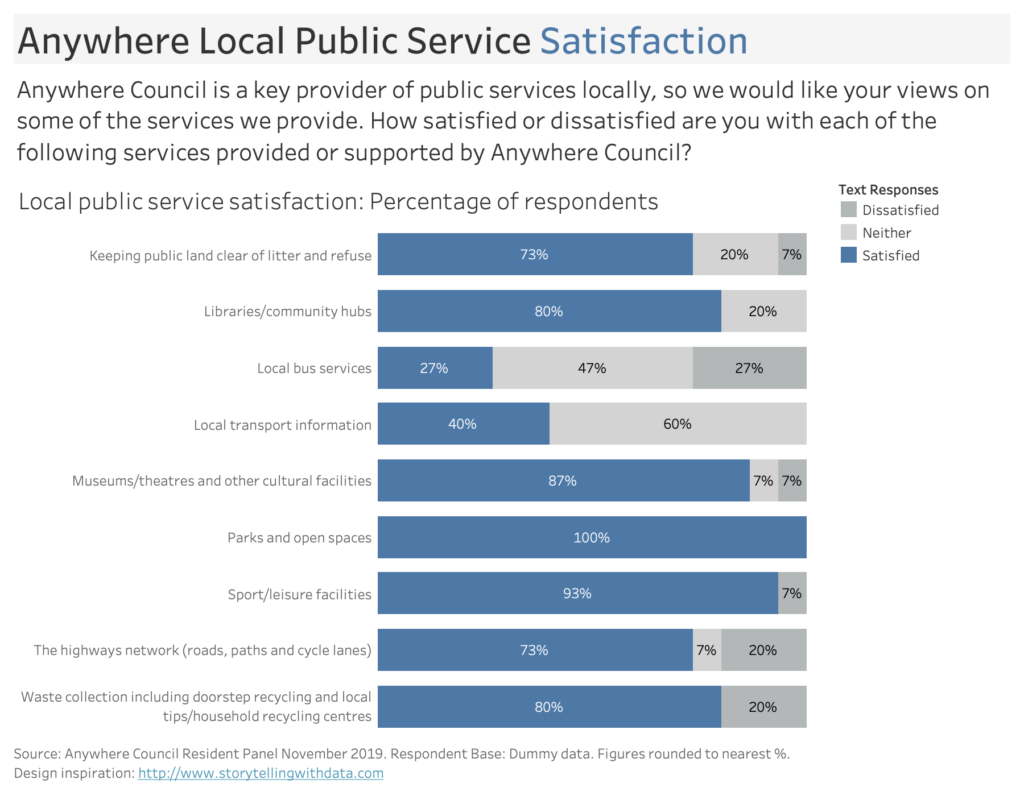
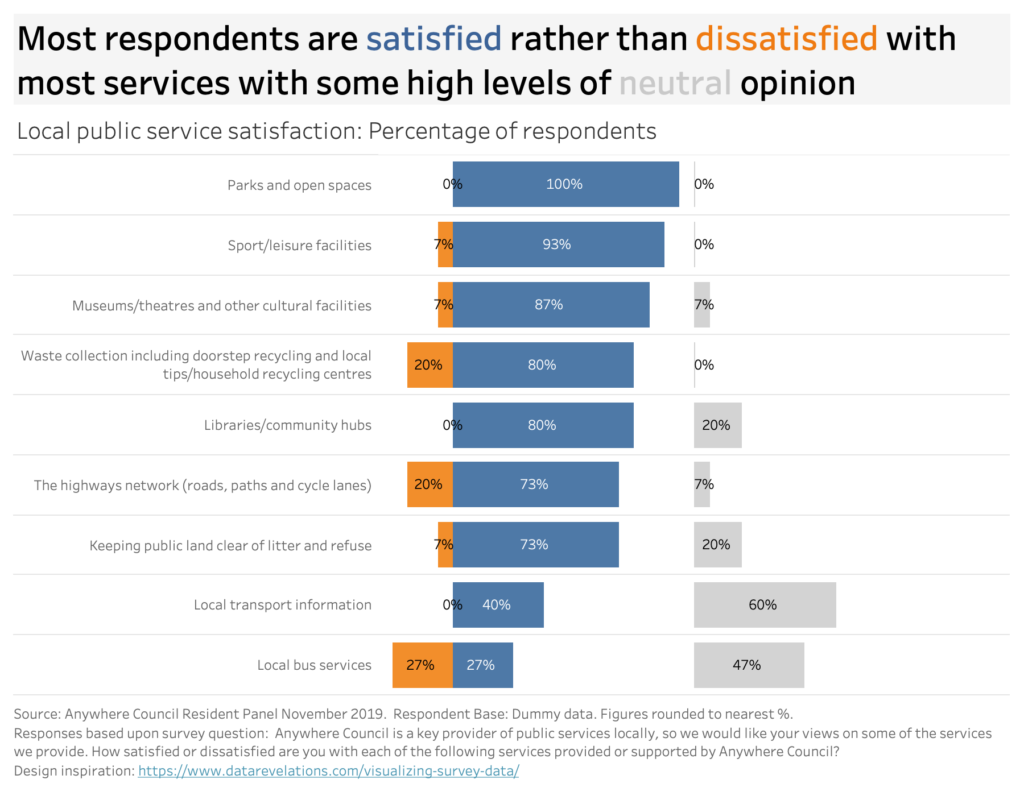
Re-design the visual
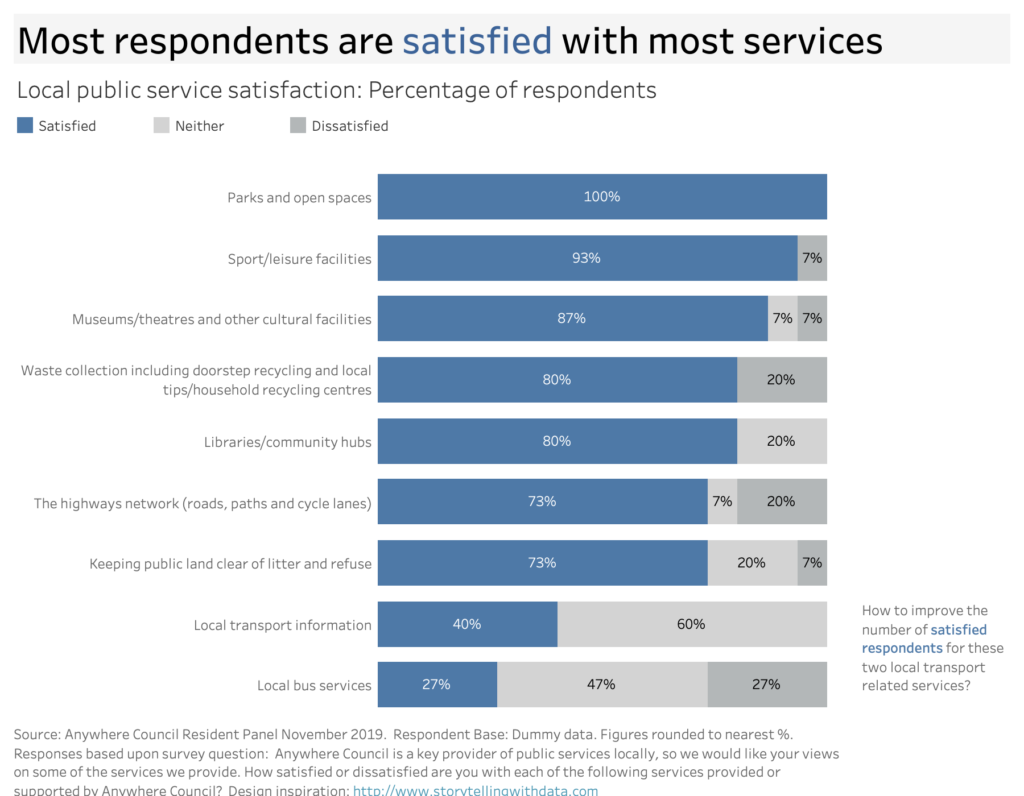
A little bit of simple re-design can help re-focus further. By sorting the services by level of satisfaction, rather than question order we can make it much easier to see which services respondents are most pleased with. The question text has been pushed into a sub-note so it is less distracting. The colour legend is moved top left above the chart, so it is the first thing we see in order to aid comprehension. This focus would suit an external audience, where the local authority wanted to promote a positive message in the media about resident satisfaction with the majority of services.
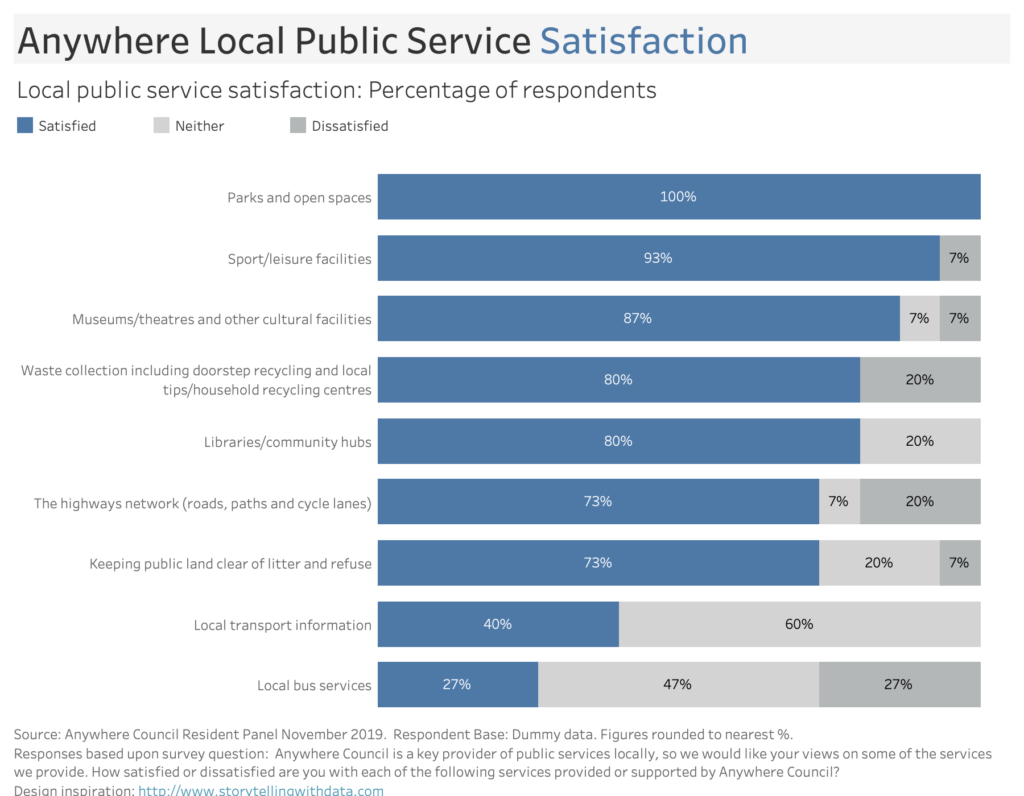
Focus attention through storytelling
An explanatory title adds some context to the visualisation. This is a take-away that tells our audience what the key insights of the survey results are at a glance. We can add to this with a call to action annotation next to the relevant results at the bottom, where satisfaction is lower. The storytelling design is inspired by a case study published in Storytelling with Data by Cole Naussbaumer Knaflic (2015).
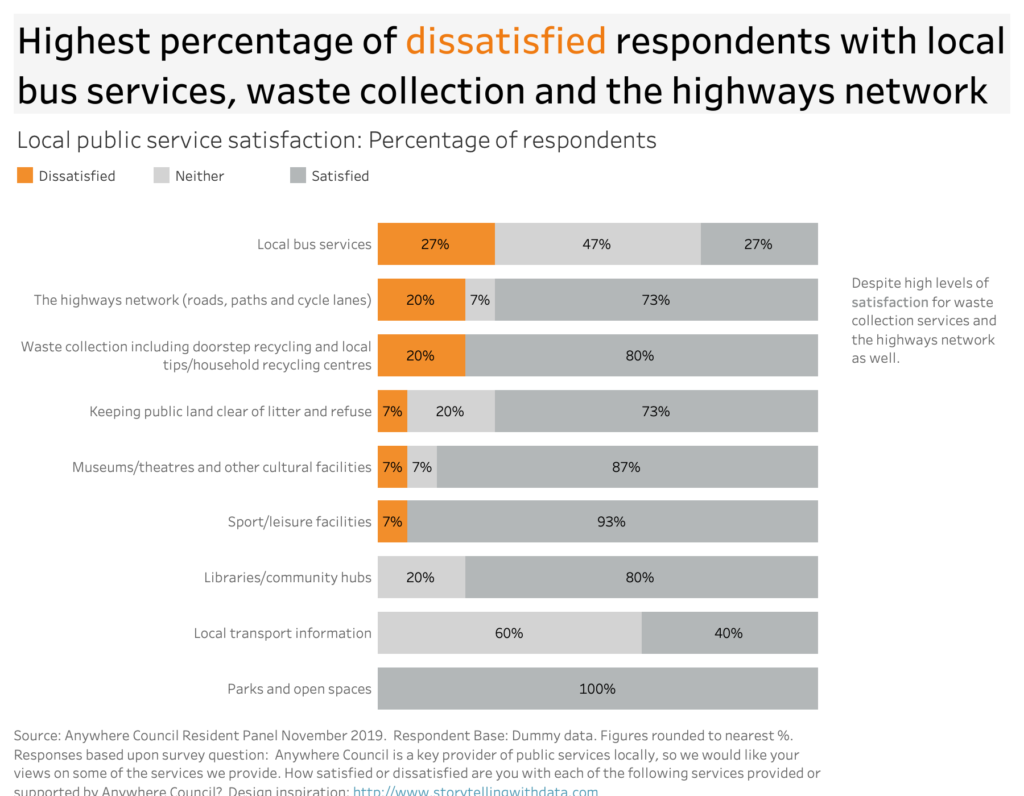
Re-focus upon negative opinion
The colour palette and order of categories can all be amended to change the focus from satisfaction to dissatisfaction. The title and annotation text can be amended to further focus upon specific services where there are the highest levels of dissatisfaction. This approach would suit an internal audience of service managers, who would be interested that for services such as the highways network or waste collection for example, there are levels of dissatisfaction despite high levels of satisfaction.
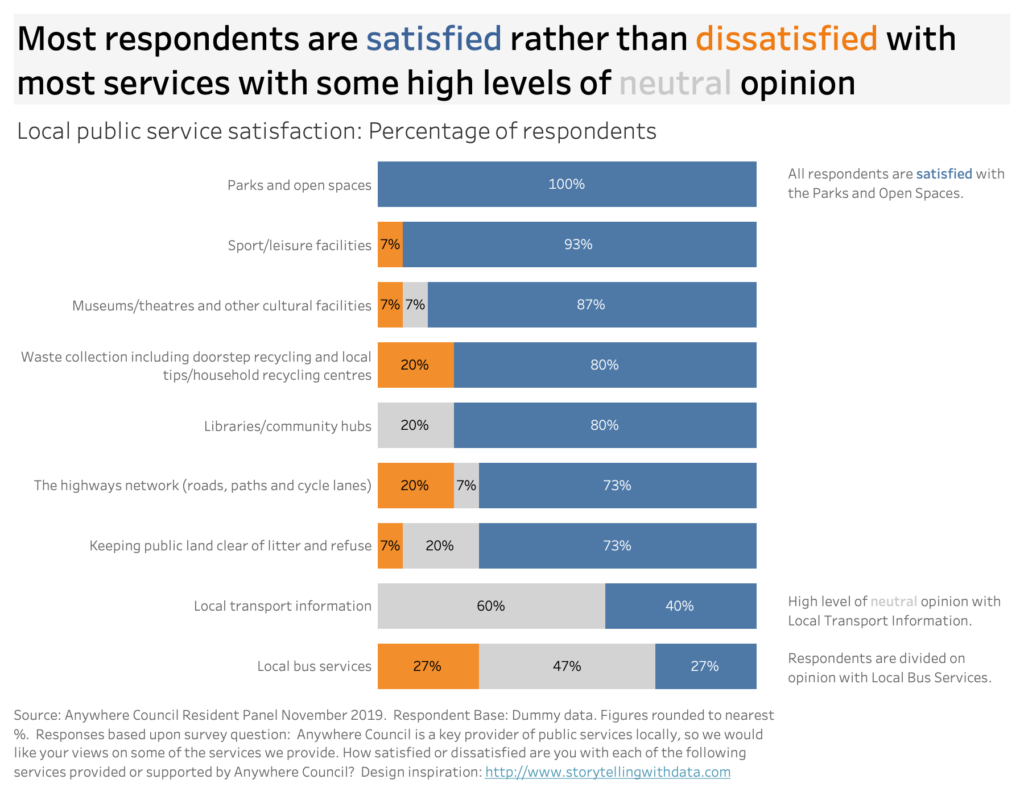
Combining the focus for a strategic audience
Supposed our audience was a strategic director who wanted to get an overview of both levels of satisfaction and dissatisfaction. In this version, the super categories are shown together with services sorted by order of positive satisfaction. This follows a logical order of negative sentiment on the left and positive sentiment on the right. Guided analysis is delivered through the title which incorporates the colour legend. Again annotation is used to pull out some key insights.
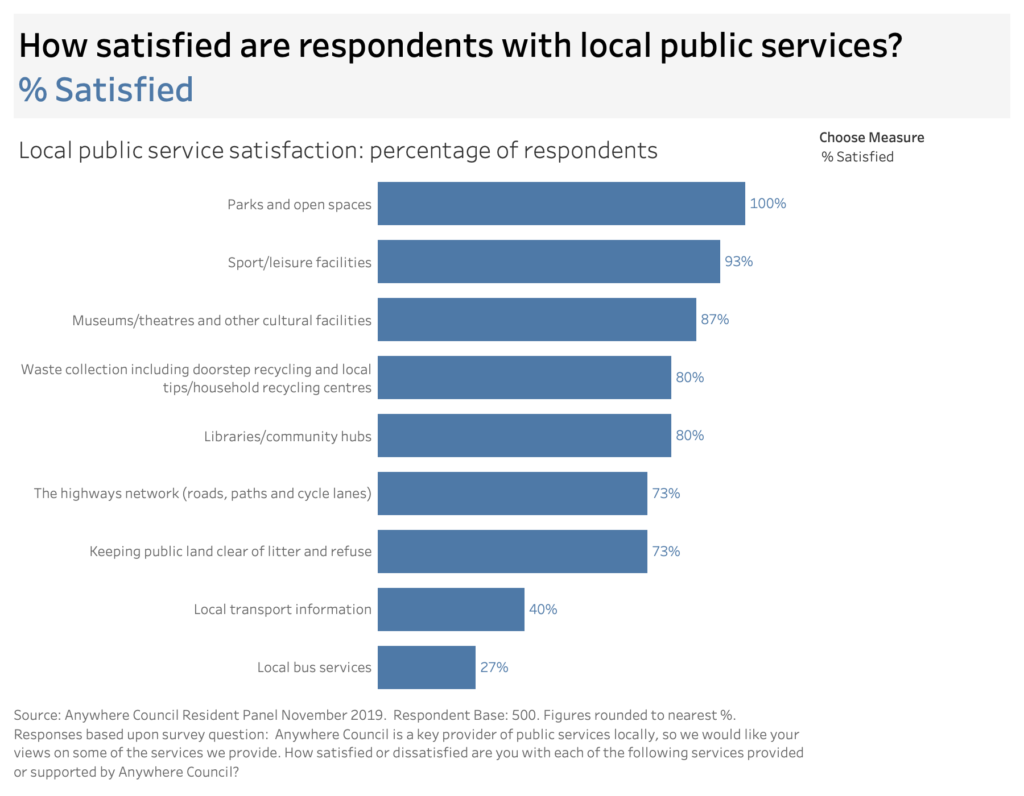
Use of interactivity
What if the analyst wants to design a visualisation that can be adapted to a wide ranging audience? With interactive functionality it is possible to let the audience choose the frame of view they are of most interest through a drop down menu.
Alternative designs
The following iterations of the dashboard design are influenced by the work of Tableau Zen Master Steve Wexler on visualising neutral responses as published on Data Revelations. In this alternative design, the neutral opinions are moved to the side as they are usually of less relevance anyway. This allows for the percentage of satisfied and dissatisfied respondents to be directly compared for each service against a zero baseline.
An internal audience may also be interested in going back to the more detailed breakdown, which included very satisfied and very dissatisfied segments. How can the level of detail be shown without cluttering the view with too much information to process? A design I like from Data Revelations shows how splitting the positive, neutral and negative opinions up allows each super category to be compared against a common baseline. This makes it easier to compare responses across each super category, whilst maintaining a level of detail.
The starting point was a visualisation which provided accurate results but with a detailed frame of view and no focus. Categories were combined to provide a simplified frame of reference. Colour, position and text were adapted to change the focus of the visualisation. Changing the frame and focus helps tailor the visualisation to appeal to different internal, external or strategic audiences. Where it is required to show detailed categories together, alternative designs were applied to break up the view making it easier to draw comparison.
Recent Comments