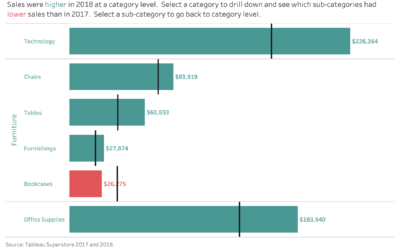
Let’s Practice Colour + Words in Data Visualisation
Colour and words are therefore a quick and easy way to highlight one of many potential insights from the data.
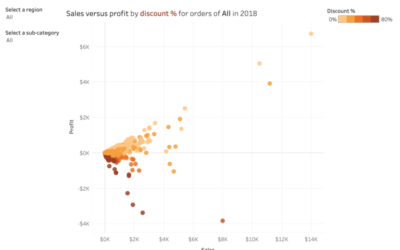
Drill down into sales performance!
By using interactive features such as dashboard actions we can reveal hidden insights all within the same dashboard!
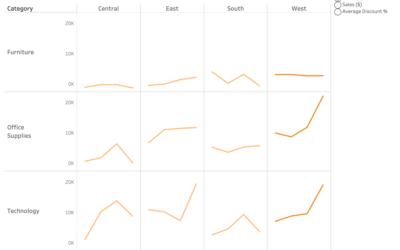
Interactive Small Multiples
In my approach I use interactive parameters to drive the analysis, allowing users to select different measures.
Data Visualisation for Decision Making
A challenge social research analysts quite often face is how to effectively communicate data which will inform the solution to a particular social problem or issue. Decision makers quite often feel over whelmed by the wealth of information available. We need to reduce the time it takes for them to understand an issue and make an informed choice of how to resolve it. How do we go from a list of numbers to a clear message, which can inform a business decision such as where to target resources?
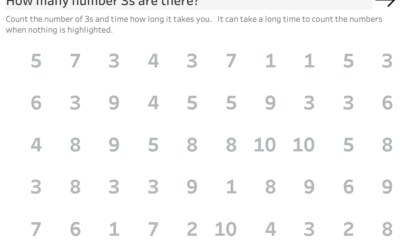
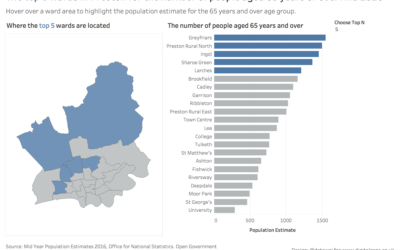
How to focus your audience’s attention in your data visualisations?
We have seen how the human brain processes visual information through iconic, short and long term memory. Pre-attentive attributes such as colour, length and position are visual properties that are processed very quickly in the sub-conscious memory. As data visualisers we can leverage pre-attentive attributes to focus our audience’s attention to highlight key performance issues.
Visually analysing the answers to why?
Building different views allows our audience to see different insights from the same data. This means being able to quickly ask and answer business questions. This is important to be able to see the underlying cause of problems. It also means that we can go exploring in detail different paths of analysis, which is a great way to engage our audience’s curiosity.
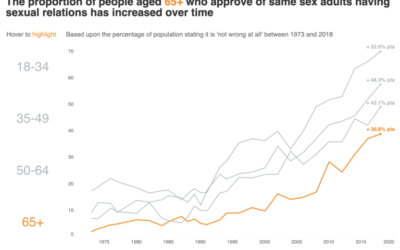
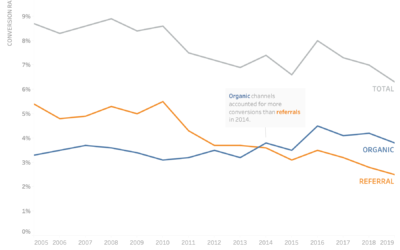
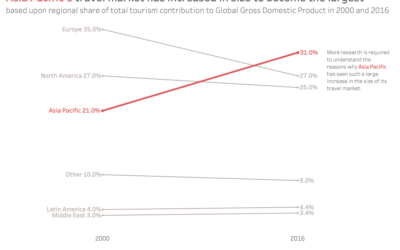
Highlighting data trends with interactive visualisations
Quite often we will see data visualisations which try to stand out by using too much colour. The problem is that this can lead to cognitive overload as there is too much to process. Additionally when everything is the same colour then nothing really stands out.
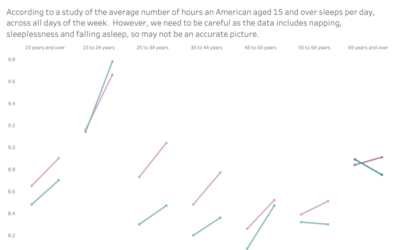
Visualising American sleep patterns over time – but can we trust the data?
One of the challenges of analysing data is dealing with imperfect datasets. For this week's #MakeoverMonday Challenge, I visualised the sleep patterns of Americans by age and gender over time. The data is interesting as it shows most Americans aged 15 and over are...
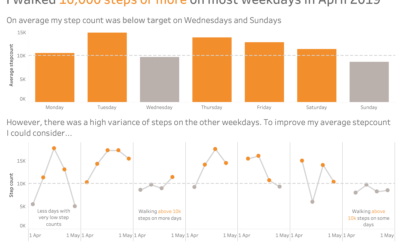
Visualising my step count: bars and lines together add insights
Analysing the data as aggregate bar charts and individual points on a line made me think about different ways I could improve my average step count.
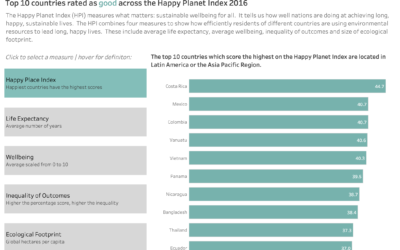
Which are the happiest countries? Visualising the top 10 countries on the Happy Planet Index
Set actions are versatile: the metric calculation can be used to change the chart, title and colour of the measure selector!
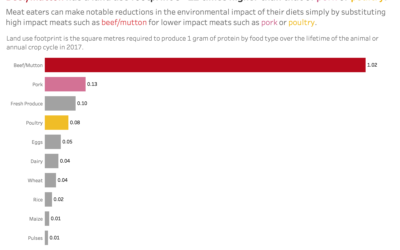
How can meat eaters reduce the environmental impact of their diet?
By using colour and an insightful title, we can focus our audience’s attention to a key take-away.
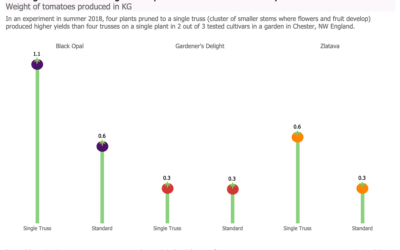
How to evaluate the results of an experiment visually using data?
The lollipop chart is a simple, fun variant on the bar chart whilst retaining most of its accuracy.
How we can focus our data stories?
Through employing some storytelling techniques, including choosing an appropriate chart type, strategic use of colour and size and removing confusing or complicated elements we can enhance the focus of our data story.
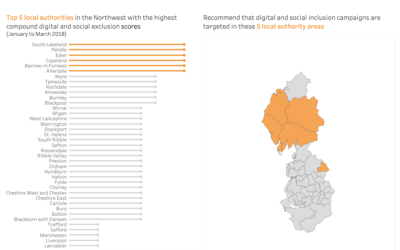
How can data visualisation support better decision making in the public sector?
There are a range of benefits that data visualisation can bring to help the public sector make better decisions. However, the type of visualisation we build depends upon the audience.
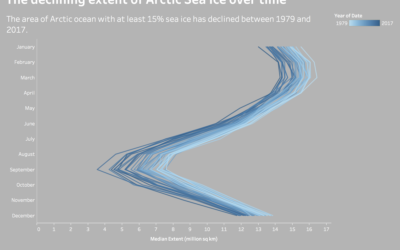
Data visualisation can unlock hidden trends that require action!
Data visualisation can help unlock hidden trends through use of colour or insightful titles for example. This insight can be used to inform decision making before it is too late.